An Introduction From ESC Insight’s Ewan Spence…
ESC Insight has welcomed the increased transparency around the voting at the Eurovision Song Contest over the last few years. From the release of the full voting breakdown from jury members and the names of the jurors, to details on the criteria supplied to jurors and a basic understanding of televoting thresholds, our belief is that the Song Contest should not only be a fair Contest, it should also be seen to be a fair Contest.
Hiding any process in the Song Contest voting creates a ‘black box’ that nobody can understand – and in a closely scored event if that black box decides the winner how can it be seen to be fair Contest?
There must be precautions to ensure that juries are offering their honest opinions and that public voting does not lead to stuffing the ballot, and it would be wrong to ask for the EBU to reveal the details. But the process behind decisions and the general principles can be demonstrated in such a way as to preserve the integrity of the vote.
Security by obscurity is not security at all, it is theatre. Which is why the situation around San Marino’s ‘public’ vote feels wrong.

Serhat doesn’t know either (image: eurovision.tv / Klaus Roethliesberger)
To recap, the change in the voting presentation for 2016’s Eurovision Song Contest meant that each country was required to produce both a jury result and a televote result. Because of San Marino’s size (and sharing its phone system with Italy) it has never been able to produce a televote with the volume required to pass the confidence threshold required. In previous years San Marino defaulted to a 100 percent jury vote. Rather than simply carry over the jury vote to the public voting in 2016, the EBU decided that the televote would be constructed from televotes across Europe (“In accordance with the Rules, the televote from this country have been replaced by an average result of a representative group of televote results of other countries.”)
The televote from San Marino actually has nothing to do with any views from the San Marinese population; The countries that are involved in making up the televote are at a slight disadvantage because they cannot vote for themselves (potentially denying them points from San Marino); and the televotes in these countries have fractionally more power because they are counted more than once. And the San Marino Delegation do not know how the vote was calculated.
A smarter approach would be to find a way to poll the San Marinese population to create a ‘public’ vote – something that the San Marino delegation has suggested:
“The proposal creates a statistically representative sample of viewers from a set number of people living in San Marino. These public ‘panel members’ would be required to watch two of the three Eurovision broadcasts and vote via the web in the same window of voting used by other European television viewers. The vote of this ‘panel’ would join that of the jury to go to form the total vote at the San Marino Eurovision Song Contest. Obviously in case of problems or malfunctions of the simulated remote voting system, the European Broadcasting Union may then resort to an emergency vote putting the current system to use not as a primary option, but as a backup.”
There’s also another issue in regards transparency. Nobody publicly has confirmed which countries were used to make up the San Marion televote, and the Eurovision community has been asked to trust that it is representative.
ESC Insight’s Ellie Chalkly and Ben Robertson have sat down with everything we know about the 2016 televotes, the guidance from the EBU, and San Marino’s final scores. Was the televote representative? Was it statistically transparent? Was it fair?
Over to Ellie and Ben…

No…. not that Ellie and Ben. Our Ellie and Ben (photo: Derek Sillerud)
Analysing San Marino’s 2016 Televote
This year the Eurovision Song Contest voting system was radically overhauled. One of the lesser publicised facts from the new rules was that countries without a televote at threshold level will have a ‘televote’ created for them from the results of other countries.
Come San Marino, Eurovision’s tiniest nation. As we know, San Marino has no independent telephone system and a very small population. Therefore it has always been impossible for San Marino to have a Song Contest televote. In the past, San Marino’s score has been made from the jury ranking alone, rather than the combination of a jury ranking and televote ranking.
Instead this year San Marino’s televote ‘douze points’ went to Jamala from Ukraine, with 10 points to Russia and 8 points to Lithuania. How this result was calculated has been kept out of the public eye, with the EBU Reference Group choosing not to reveal how this has been produced.
Our starting point was this:
- The EBU produced full rankings of the Semi Final 1 and Grand Final rankings for the jury and simulated televote.
- The EBU use a system of pots of countries with broadly similar voting patterns in order to ensure that voting clusters are spread evenly between the two semi-finals.
- The EBU say that the simulated San Marino televote is based on the average televotes of a pre-arranged set of countries.
Using the above facts, we have been able to reach some conclusions about the San Marino televote. There’s lots of maths to explain how and why, but here are the headlines.
- It is possible to reconstruct the San Marino televote in Semi Final One using an arithmetically simple method.
- It is not possible to reconstruct the San Marino televote in the Grand Final using the method used to generate the SF1 televote.
- In Semi Final One, our simulated televote was based upon the self-excluding score average of the Maltese and Czech televotes.
- In the Grand Final, the closest answer we’ve found to recreating the simulated televote is by combining the scores of Georgia, Ireland, Latvia, Lithuania, Poland and the UK.
- There is almost certainly no influence from the scores of the Italian televote or the San Marino jury.
A Czech, Maltese and San Marinese Triad
Using the three nuggets of information from the EBU before our analysis, we know that the countries chosen to replicate the San Marinese televote had been pre-selected. The only possible source of information for what this could potentially be like is to use the pots created by Digame, which are used to draw which countries participate in which Semi Final.
San Marino for the 2016 Eurovision Song Contest was in Pot 5, including Poland, Lithuania, Ireland, Czech Republic and Malta. Whereas this pot is spread across the continent, the vast majority of them are geographically based. For example Pot 2 is filled of Nordic and Baltic nations, whereas Pot 3 is made up of countries in the Former USSR. Pot 5 is very much an odds-and-ends grouping, although some links (Poland and Lithuania score well from Ireland traditionally) are known to exist.
The creation of these pots was to separate countries into groups which normally vote in patterns which correlate to each other. Therefore it will be harder for countries to get a ‘lucky’ draw surrounded by lots of friendly nations. It also makes sense to use this data as our starting point for calculating a San Marinese televote. For reference this was the same methodology we used in February when assessing how this would impact on previous contests.
Putting The Maths Together
In that methodology, we just used the points from the televotes of those countries rather than the full ranking. However San Marino has a full televote ranking published from first place to last place, so that simply is not sufficient. We needed to create a method where you can use Eurovision points to ‘boost’ 1st and 2nd place, as well as rank the whole way down the list.
Our solution converts the component countries televotes to a slightly weighted ranking structure. This accounts for each country’s full ranking, as well as the boost given by awarding a 12 or 10 points.
So for example, let’s use the Irish televote in this year’s Grand Final. The country that comes first (Lithuania) in the televoting gets 28 ranking points (26 points for first + 2 for the missing 9 and 11 points). The second (Poland) gets 26 points (25 points for second + 1 for the missing 9 points), the 3rd (Russia) gets 24 points and then we continue until the last placed country in the Irish televote (Serbia) which gets 1 point.
We then add the points for each country together and divide by the number of countries in the calculating pot, call this n. To calculate the points for the countries which appear in the ranking, we divide by (n – 1), because Poland obviously can’t vote for itself. In our calculations, we generalise this to (n – w) for all the countries, where w is a weight that is 1 for a country included in the averaging pot or 0 for a country that is not.
This gives us an array of averaged scores, which we can then rank in order. Given the small numbers involved, we have the likelihood of ties, which we deal with using the standard EBU countback method:
Number of countries giving points
Number of 12s
Number of 10s
Number of 8s
And so on down the ranking
First, let’s calculate the Semi Final 1 scores. The only other Pot 5 countries in SF1 with San Marino were the Czech Republic and Malta. A small sample size, but let’s check our hypothesis.
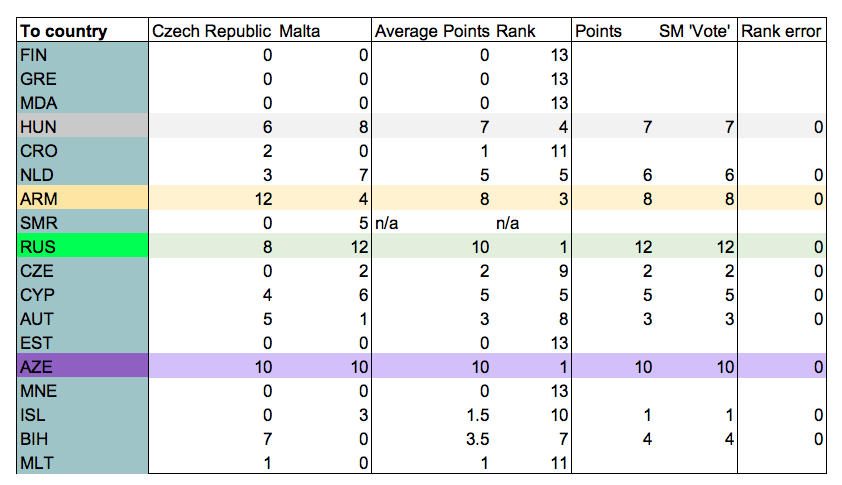
This methodology worked. As you can see in the table using this data is a perfect match up for the San Marino televote. The ties you can see in the table are corrected when you apply normal tie-break procedures. It therefore seems sensible to suggest that the countries in the same pot as San Marino are the ones that make up their calculated televote.
So, let’s look at what the simulated televote would be if the Pot 5 countries were used to on the Saturday night. Roughly the right countries are in the points scoring zone, but the order is different. Russia gets 12, Ukraine 10, Australia 8.
In most combinations we attempted there are two big problems. One, there is only a small group of combined countries that put Ukraine ahead of Russia and two, an even smaller handful put Lithuania above Poland (which was 4th in San Marino’s televote). Lithuania’s 3rd place finish is troubling, only four other countries ranked Lithuania top 3 in their televote: Ireland, Norway, Latvia and the UK, and all the other countries in San Marino’s pot placed Lithuania outside the top ten. This is far too low to keep a 3rd place from Ireland’s ‘douze’ alone. Our system that worked for the Semi Final clearly is insufficient for the Grand Final. Either our Semi Final calculation is a freak, or something different is going on here.
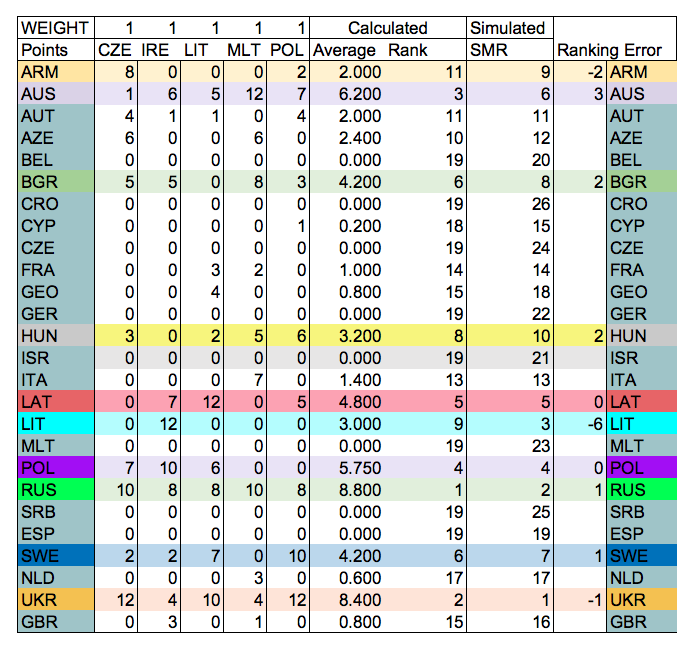
(Table 2: Using a points-only method for the Pot 5 countries in the Grand Final)
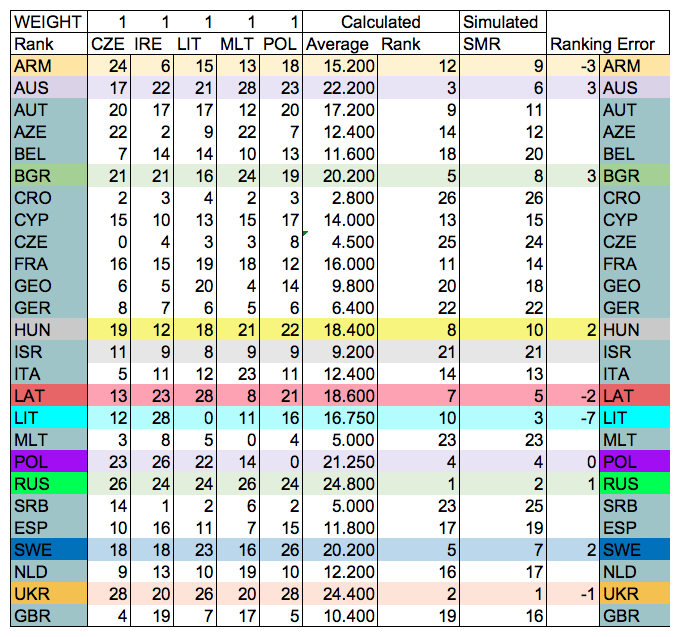
(Table 3: Using a full ranking system, including the points boost for first and second place, for the Pot 5 countries in the Grand Final)
What Combination Does Work?
If the San Marino simulated televote is the result of averaging some of the 41 other countries in the Eurovision Song Contest, the answer must lie somewhere. What we should be able to do is rather than put in which countries we think match the data, calculate this the other way around. One way of doing this is to use the non-negative least squares fitting algorithm to generate the set of weightings from the potential score components and the end result. In non-maths terminology this is a system which attempts to find which of the data will best fit our answer.
If we are correct in believing that the San Marino televote of Semi Final One was composed of a self-excluding unweighted average of the Czech and Maltese televotes, then we assume that the Grand Final votes are also a self-excluding unweighted average.
Here is our worked example. Let’s see if we can calculate an average of the Pot 5 televotes and then see if we can retrieve the right countries with the non-negative least squares (NNLS) function.
Constructing the average:
Multiply each score by either 1 (if it corresponds to a Pot 5 country) or 0 (any other country) and add the totals. Divide by 5 if the country wasn’t in the GF or 4 if it was.
Votes – a 26 x 41 matrix containing all the televotes in points-adjusted rank format
Weights – a 41 x 1 matrix that tells us which country is included in the average
Score – a 26 x 1 matrix giving us the total televote ranking points given to each country. You’d need to divide this by the number of components in the average to get the rank back, but because that’s a linear operation the NNLS should be able to see through this.
votes weights = score
We then put score and votes into the NNLS function and retrieve a 41 x 1 matrix that represents the algorithm’s best guess at what the weights matrix was. In this worked example, we made a weights matrix from our favourite Pot 5 countries, which you can see in the column marked INPUT. In the right hand column, you can see what the NNLS algorithm retrieved from the combination of score and votes. You can see that the five countries put in are the five countries that come out, plus some extremely small values next to other countries that are basically computational noise.

For example, here are some of the values you get when you run the non-negative least squares test on different sub-sections of the Grand Final data.
NNLS Trials run:
All 41 televotes
All 41 televotes + San Marino Jury
Limited to Pot 5
Pot 5 + Italy + San Marino Jury
Pot 5 + Italy
Pot 5 + UK + San Marino Jury
Pot 5 + UK
Running NNLS on all 41 televotes and 41 televotes + SM jury
NNLS results on Pot 5 only and Pot 5 + UK

(Table 4a – NNLS results for all 41 televotes, and all 41 televotes + San Marino Jury)
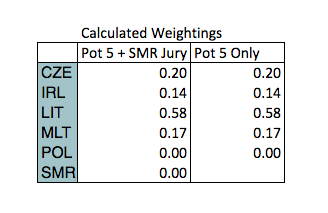
(Table 4b – NNLS results for Pot 5 countries + SMR jury, and Pot 5 countries only)
The Non-Negative Least Squares test didn’t produce any sets in which all contributing scores had equal weighting, or that reproduced the key results like Ukraine beating Russia or that Lithuanian 3rd place. This suggests that the San Marino televote was not the result of a simple average of a pot of other televotes, contrary to what the EBU says about the method, and our successful reconstruction of the SF1 televote. We’ve also tried running NNLS on the points alone, the ranks without points adjustment, and on the reciprocal of the ranks and none of these has produced a successful result. There really does not seem to be a combination of the published televotes that can be used to generate the San Marino result.
Even though NNLS didn’t find a solution, some combinations had interesting parallels. We could alter some of the results by increasing or decreasing the ‘weight’ of different countries results, making them stronger or weaker. For example we noticed that Ireland and Lithuania were highly weighted in many of these trials, meaning the mathematics worked better when these countries gave more points than the others. However even tinkering with the number of countries in the mix to have more or less didn’t find the perfect answer.
The highlight though is that none of the trials of all 41 televotes suggested that the Czech or Maltese televotes formed a component of the simulated San Marino Grand Final televote.
As we said, none of our models found a perfect match, but we used these models to put together combinations of countries to average manually. Based on this method, our closest match for the points-scoring top ten is made from combining Georgia, Ireland, Latvia, Lithuania, Poland and the UK. The UK is a reasonable Big 5 fit for Pot 5 – we can assume that they complete a UK-Ireland-Malta voting cluster. The UK and Ireland also have significant Polish and Lithuanian diaspora populations, which could be linked to the high performance of Poland and Lithuania in the UK and Ireland televotes. It certainly makes the UK a far better match than Italy, which of course surrounds the microstate. Latvia and Lithuania form a voting partnership, with high numbers of televotes exchanged, but other than the result of the fit algorithm, there’s no obvious rationale for the inclusion of Georgia.
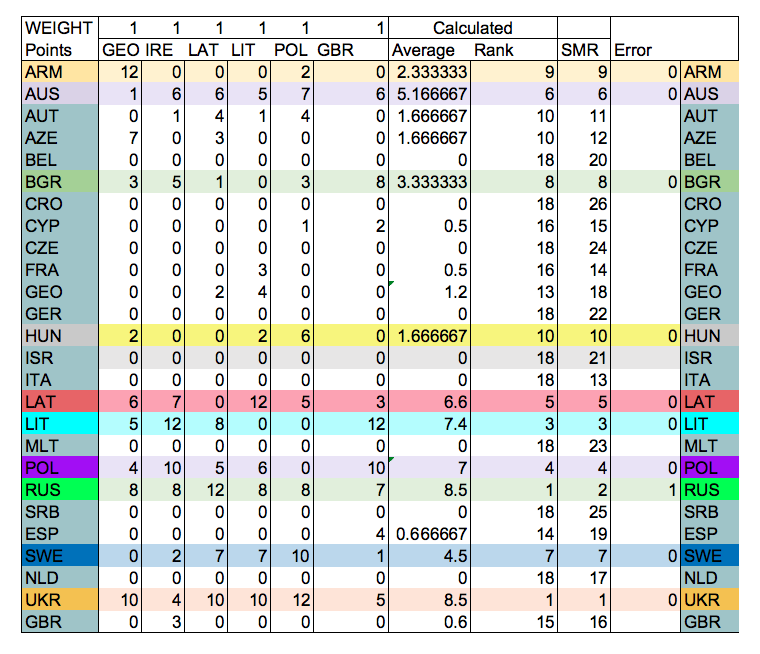
(Table 5: Using a points-only method for our best-fit countries in the Grand Final)
By just using the points, this model works almost well enough to predict the first nine scores (Ukraine gets the 12 on countback), but there’s no reasonable scenario to give Hungary the 1 point. Austria has points from 4 countries, above Hungary’s 3, so should take the 10th place.
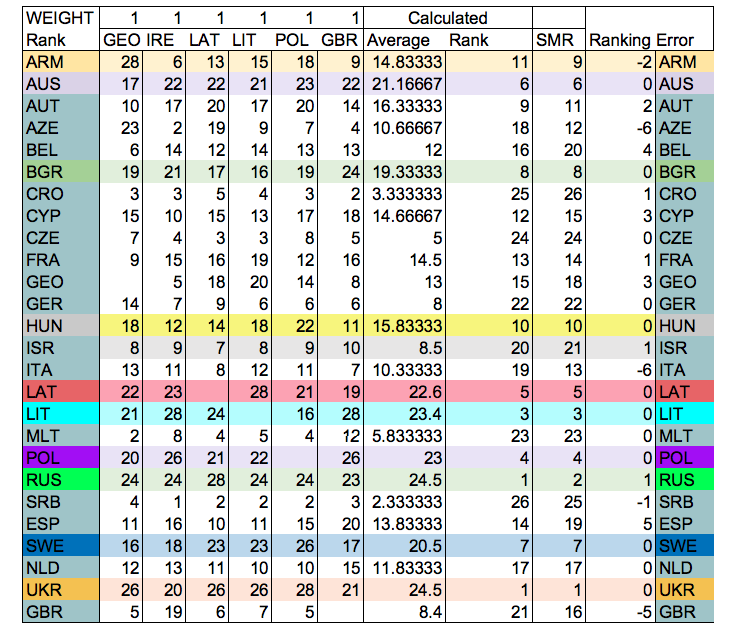
(Table 6: Using a full ranking system, including the points boost for first and second place, using our best-fit countries in the Grand Final)
Extending this model out to the full ranking exposes how much of a mess it is – Azerbaijan, Italy, Spain and the UK are all out of the scoring zone, but you’d hope that the model would be able to generate a more stable fit at the lower end of the ranking.
This was as close as we got to making a solution. There are in the end only a few country combinations that get the top four to be in that order, and none of them using our method come out with an acceptable level of accuracy.
The solution with the best R2 (residuals squared – a measure of the quality of a fit) generated from this model did not correctly predict the top ten ranking and doesn’t include the ‘5 or 6’ countries mentioned in previous descriptions of the method, but we’ve included it for completeness. This solution was produced using the NNLS fit on all 41 televotes and uses the televotes of Georgia, Ireland, Lithuania and Malta and is clearly far from perfect.
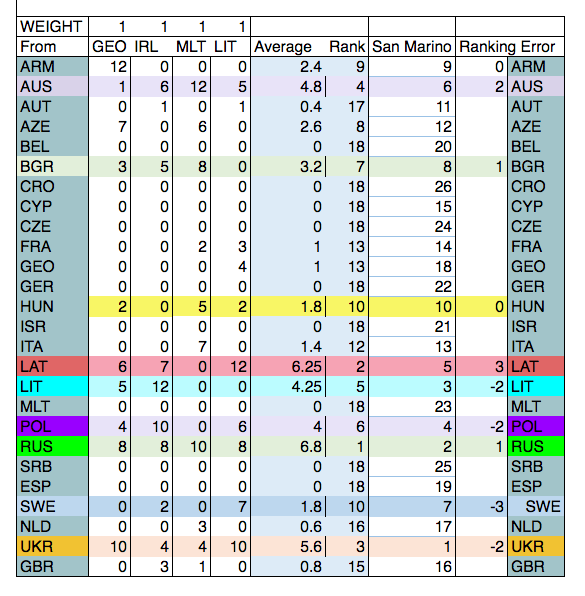
(Table 7: Geo, Ire, Lith, Malta combination)
Where Do We Go From Here
Our hypothesis works so brilliantly well for the Semi Final that it would be a bold researcher who would dismiss our methodology for working out the San Marino televote. It takes what we would expect to be the pre-determined countries, combines the points together to get an average, and then uses the average positions in the televote to work out points lower than zero. It is the most simple solution, and in one of the shows it worked pristinely well.
However it hasn’t worked for the Grand Final, and is way off correlation to just be a calculating error on our side. There are some things that could be the case:
- The method used is not one of the numerous ways we have demonstrated in this report
- Other countries were selected that were not from San Marino’s pot
- Mistakes were made in the EBU’s calculations of the San Marino’s result
We have toiled through the data and through many different combinations for results that are not shown here. We have found an approximation but not a definitive answer to where San Marino’s televote came from. We simply don’t know how it was created. We question if the technique to calculate it is far more data heavy, perhaps using percentages instead of rankings, and therefore something nigh on impossible to reproduce with the information we have.
But we don’t know that. And if we can spend hours going through EBU data and not come to a correct conclusion, we have to anticipate this must surely be more complex than we first thought. Where and how it could be more complex though is a mystery to us and also a mystery to fans, journalists and even delegations involved in the Eurovision Song Contest. Is that a fair way to create a San Marinese televote?


An observation: This is a “contest” that no longer even bothers to prescribe, in the official rules, how the final scores are determined, saying only that “The points of the National Juries and of the National Audiences shall be combined according to a ratio which is determined by the EBU, subject to Reference Group approval.” (Source: https://www.eurovision.tv/upload/2017/2017_ESC_rules_EN_FINAL_PUBLIC-08-07-2016.pdf)
This ship has sailed. The EBU has determined that transparency and consistency are unnecessary impediments to their big annual TV extravaganza, and they don’t even care who knows it. The dogs bark, but the caravan moves on.
It’s something I think you just have to accept as a continuing ESC fan at this point.
(Also, a serious non-rhetorical question: Has the Reference Group ever said “no” to the EBU, and if so, about what?)
Does anyone really know? 🙂
https://i2.wp.com/wiwibloggs.com/wp-content/uploads/2015/06/mavmk.jpg
Fabulous analysis!
MAwnck, that rule change allows the percentage to change as required, if signed off by the rules committee, and then we would all hear. It is current stated that the split is 50/50. I see no issue. As for ‘transparency’ the Contest is far more transparent than it was even five years ago.
Ellie and Ben – great bit of work. People have got PhDs for less than this! I don’t profess even to begin to understand your analysis. My observations are simpler. What’s so wrong with any of the following solutions?
1. San Marino don’t get to award televote points at all.
2. San Marino’s televote points are simply their jury points repeated.
3. As suggested above, there is some sort of representative telephone panel of San Marino citizens.
4. There is a second small San Marino ‘non-expert’ citizen/fan jury – in much the same way as we had a kids jury at JESC this year.
Surely any of the above have the advantage that they are transparent and you don’t need a brain the size of Stephen Hawking’s to fathom out what is going on.
Robert, It is my understanding that some of those solutions are under active discussion.
Why not allow the San Marinese public to use an app to vote that is geo-fenced within the borders of San Marino? And/or use caller ID to only allow votes from Italian landline numbers in the 0549 area code (which apparently is for the sole use of San Marino).
Such technical issues shouldn’t exist these days.
Excellent piece – have the 2017 and 2018 data sets shed any light?