


Following on from our previous two editions of Voting Insight, today ESC Insight will look in further depth at the 180 jury members of the 2014 Eurovision Song Contest.
We are looking to assess if the background of the jury members is a significant factor to the voting process. We will examine the ages, genders and professional backgrounds of our jury members to assess if there are trends between the different groups and how they have voted as jury members.
As stated by the European Broadcasting Union (EBU) the aim is that ‘there shall be a balance among the members of each National Jury to ensure that sufficient representatives in terms of gender, age and background.’
Ben Robertson will test how important these factors to the contest and highlight any differences that arise.
Gender Balance In The Eurovision Song Contest
The balance of gender was not fully achieved by the EBU in the selection of jury members. As we discussed on the release of the jury names on May 1st, 30 of the 37 juries had more male than female representatives. The final group of jury members (some changes were made after the May 1st release in Lithuania, Macedonia, Israel and Albania) included 79 female jury members and 106 male jury members, however our analysis removes the three females and two males from Georgia’s results due to them being voided by the EBU.
We look to see if there is a difference in voting between males and females. To do this, we take the rankings of songs in the Grand Final and the full rankings from first place to last place of all male jury members and all female jury members and calculate the average of these. We then compare the two tables to see the biggest differences. The table is ordered in order from those with the biggest female support in comparison to male support first.
The Average Rankings of Male/Female Jury Members
| Country | Average Score (Male) |
Rank (Male) |
Average Score (Female) |
Rank (Female) |
Change in Average Score |
| Austria | 8.83 | 2nd | 6.84 | 1st | -1.99 |
| Germany | 14.13 | 15th | 12.57 | 13th | -1.56 |
| Romania | 15 | 17th | 13.8 | 14th | -1.2 |
| Slovenia | 15.16 | 20th | 14.04 | 16th | -1.19 |
| Denmark | 11.97 | 10th | 10.97 | 7th | -1.00 |
| Sweden | 9.18 | 4th | 8.23 | 3rd | -0.95 |
| Spain | 12.3 | 11th | 11.37 | 10th | -0.93 |
| Finland | 11.4 | 7th | 10.71 | 6th | -0.69 |
| Norway | 11.59 | 9th | 11.08 | 9th | -0.51 |
| Malta | 10.4 | 5th | 9.91 | 4th | -0.49 |
| Russia | 15.04 | 18th | 14.58 | 18th | -0.46 |
| Netherlands | 8.25 | 1st | 7.81 | 2nd | -0.44 |
| Azerbaijan | 11.51 | 8th | 11.08 | 8th | -0.43 |
| San Marino | 18.95 | 26th | 18.69 | 25th | -0.26 |
| Ukraine | 12.54 | 12th | 12.33 | 12th | -0.21 |
| Belarus | 15.08 | 19th | 15.54 | 20th | 0.46 |
| Switzerland | 15.44 | 22nd | 15.91 | 21st | 0.47 |
| Iceland | 13.62 | 14th | 14.29 | 17th | 0.67 |
| Armenia | 10.99 | 6th | 11.77 | 11th | 0.78 |
| UK | 13 | 13th | 13.92 | 15th | 0.92 |
| Montenegro | 14.32 | 16th | 15.27 | 19th | 0.95 |
| France | 17.52 | 25th | 18.65 | 24th | 1.12 |
| Greece | 15.34 | 21st | 16.53 | 22nd | 1.19 |
| Italy | 15.64 | 24th | 16.87 | 23rd | 1.21 |
| Hungary | 8.93 | 3rd | 10.2 | 5th | 1.27 |
| Poland | 15.58 | 23rd | 18.8 | 26th | 3.21 |
A quick clarification on the change in average score. A positive number indicates that the song performed better with male jury members, and a negative number indicated a increased result with female jury members.
The analysis of the data shows the huge outlying result of the Polish entry. Poland scored on average 3.21 points (and therefore placings) higher from male jury groups compared to female jury groups. If you were to only count female jury members the Polish entry finished last, whereas with male jurors the Polish song was in twenty-third position… low but well clear of the wooden spoon.
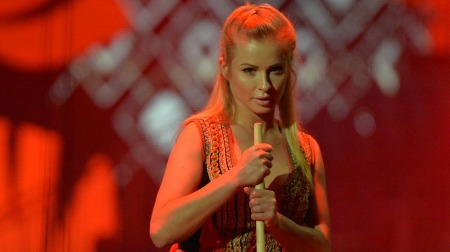
The Slavic Girls mysteriously performed much better with the male jury members (Photo: Andres Putting EBU)
No other performance was met with such a divide. Closest to this is the appearance of Conchita Wurst for Austria, with an almost 2 point difference between male jurors and female jurors. A clear winner of the contest with female jury members, this is not true for male jurors where The Netherlands was the number one ranked entry.
What is notable here is that, even with these two contrasting and controversial songs as highlights either side of the table, the actual difference in opinion between jury members is small. Should the juries of the Eurovision Song Contest 2014 been exactly 50% female and 50% male with perfect gender balance, the likely impact of this on the final result would have been minimal. Gender alone is not a significant deciding factor in what jury members like and dislike.
The Generation Game
The ages of our jury members go from fresh-faced and optimistic Oscar Zia, 17, to one of France’s best writers and lyricist, 69-year-old Boris Bergman. We will compare the results of the jury members also in terms of age to see what difference the age of Eurovision jury members gives to their voting patterns. As a simple overview to begin with, we split the 180 members into the 90 oldest and 90 youngest jury members, and look at the average points received by each country.
The Average Rankings Of Jury Age Groups
| Country | Average Score (Younger) |
Rank | Average Score (Older) |
Rank | Change in average result |
| Norway | 10.02 | 5th | 12.66 | 12th | -2.63 |
| UK | 12.48 | 12th | 14.27 | 18th | -1.79 |
| Denmark | 10.69 | 9th | 12.45 | 11th | -1.77 |
| Azerbaijan | 10.55 | 7th | 12.1 | 10th | -1.55 |
| Malta | 9.57 | 4th | 10.8 | 5th | -1.22 |
| Iceland | 13.32 | 14th | 14.47 | 19th | -1.14 |
| Finland | 10.56 | 8th | 11.66 | 7th | -1.1 |
| Austria | 7.60 | 1st | 8.40 | 2nd | -0.8 |
| Sweden | 8.49 | 3rd | 9.06 | 4th | -0.56 |
| Armenia | 11.17 | 10th | 11.47 | 6th | -0.29 |
| Netherlands | 7.93 | 2nd | 8.20 | 1st | -0.26 |
| Spain | 11.89 | 11th | 11.92 | 8th | -0.04 |
| Switzerland | 15.63 | 19th | 15.64 | 22nd | -0.02 |
| Germany | 13.54 | 15th | 13.40 | 13th | 0.14 |
| France | 18.11 | 25th | 17.89 | 25th | 0.23 |
| Poland | 17.10 | 24th | 16.78 | 24th | 0.32 |
| Greece | 16.08 | 22nd | 15.61 | 21st | 0.47 |
| Italy | 16.51 | 23rd | 15.80 | 23rd | 0.71 |
| Ukraine | 12.88 | 13th | 12.01 | 9th | 0.86 |
| San Marino | 19.35 | 26th | 18.35 | 26th | 1.00 |
| Romania | 15.01 | 16th | 13.97 | 15th | 1.05 |
| Slovenia | 15.27 | 17th | 14.12 | 16th | 1.14 |
| Russia | 15.52 | 18th | 14.18 | 17th | 1.34 |
| Belarus | 15.99 | 21st | 14.57 | 20th | 1.42 |
| Hungary | 10.19 | 6th | 8.72 | 3rd | 1.47 |
| Montenegro | 15.65 | 20th | 13.79 | 14th | 1.85 |
As with the gender results , we have run a comparison on these tables with the difference between the average ranks. A negative value implies that there is a trend that younger jury members like a song more, and a positive value suggests more support from older jurors.
From these results we have as a rough guide evidence than Montenegro was a clear victor with older jury members, while Norway, and to a lesser extent the United Kingdom and Denmark, were strongly supported by the younger jury members.

Silent Storm was appreciated much more by younger jury members than old
Like with the differences in gender we found previously, the number differences here show that the differences in taste as dependant on age are not alone a decisive factor in terms of the average change in ranking.
However with 180 jury members voting, to have a clear cut difference is significant. To measure this significance, we take the calculations for significance we used in our to work out the rank correlation of each song compared to the ages of all the jurors. Again, we use a negative correlation to suggest a song does better with younger jurors.
Rank Correlation Figures for Each Song Compared to Age of Jurors
| Country | Change in average result | Rank Correlation |
| Norway | -2.63 | -0.242 |
| Denmark | -1.77 | -0.208 |
| UK | -1.79 | -0.201 |
| Finland | -1.1 | -0.193 |
| Austria | -0.8 | -0.145 |
| Iceland | -1.14 | -0.142 |
| Azerbaijan | -1.55 | -0.117 |
| Sweden | -0.56 | -0.109 |
| Netherlands | -0.26 | -0.086 |
| Malta | -1.22 | -0.034 |
| Armenia | -0.29 | -0.02 |
| France | 0.23 | 0.039 |
| Hungary | 1.47 | 0.041 |
| Germany | 0.14 | 0.052 |
| Russia | 1.34 | 0.054 |
| Poland | 0.32 | 0.061 |
| Spain | -0.04 | 0.067 |
| Romania | 1.05 | 0.074 |
| Ukraine | 0.86 | 0.079 |
| Switzerland | -0.02 | 0.089 |
| Italy | 0.71 | 0.139 |
| San Marino | 1 | 0.143 |
| Belarus | 1.42 | 0.152 |
| Slovenia | 1.14 | 0.159 |
| Greece | 0.47 | 0.164 |
| Montenegro | 1.85 | 0.176 |
90% confidence = 0.127
95% confidence = 0.151
99% confidence = 0.197
With these figures we are able to have varying degrees of mathematical confidence about the correlation between the age of jury members and their voting patterns.
We are 90% confident that a relationship exists for voting of Belarus, Iceland, Greece, Austria, 95% confident for Montenegro, Slovenia and Finland and 99% confident with Norway, Denmark and the United Kingdom.
In looking for links in terms of which types of songs are doing better with different jury ages, it is hard to find an obvious trend. Montenegro, Greece, Slovenia and Belarus, shared little this year in terms of their staging or song style to have an obvious trending factor that would favour older jurors. Equally little is similar between Iceland, Austria, Finland, Norway, Denmark and the United Kingdom, that can be specifically noted as a factor that is a vote-winner for the younger jury demographic.

Greece’s rap entry was rated in the top 10 by 11 of the 15 oldest jury members, but struggled elsewhere (Photo: Andres Putting EBU)
Singers, Songwriters and Sculpture Makers
The one final groupings that we can do is to investigate the impact of the professions of each jury member and see if trends lie within their different jobs. Do singers and songwriters have different tastes? Are producers going to share voting preferences with journalists?
To do this, we split the jury members into one of the following different groups:
Composers (24), Journalists (11), Musicians (14), Other (11), Producers (26), Record Company Workers (7), Singers (71), TV and Radio Hosts (16)
Working out which group applied to so people was difficult because some people can easily fall into more than one category. The decision for which group was in these cases based on what was most prominent based on the detailed descriptions as provided by the EBU.
To compare these, we put the average ranks of each of these jury member groupings into following tables.
| Country | Musicians | Composers | Journalists | Producers | Record Label | Singers | TV and Radio Hosts | Others |
| Hungary | 1st | 5th | 4th | 3rd | 13th | 6th | 3rd | 7th |
| Malta | 2nd | 7th | 6th | 10th | 8th | 4th | 5th | 2nd |
| Armenia | 3rd | 4th | 21st | 7th | 6th | 12th | 6th | 6th |
| Ukraine | 4th | 9th | 12th | 12th | 16th | 11th | 17th | 9th |
| Italy | 5th | 15th | 24th | 21st | 24th | 23rd | 24th | 21st |
| Denmark | 6th | 17th | 17th | 9th | 4th | 8th | 4th | 10th |
| Netherlands | 7th | 2nd | 1st | 4th | 2nd | 3rd | 1st | 1st |
| Germany | 8th | 13th | 16th | 15th | 17th | 15th | 20th | 12th |
| Finland | 9th | 10th | 7th | 5th | 7th | 7th | 7th | 15th |
| Slovenia | 10th | 18th | 10th | 19th | 19th | 17th | 15th | 24th |
| Azerbaijan | 11th | 6th | 13th | 6th | 15th | 9th | 12th | 3rd |
| Russia | 12th | 19th | 20th | 14th | 18th | 20th | 13th | 8th |
| Spain | 13th | 11th | 3rd | 8th | 14th | 10th | 16th | 18th |
| Belarus | 14th | 16th | 26th | 11th | 26th | 19th | 19th | 16th |
| Switzerland | 15th | 24th | 14th | 22nd | 11th | 21st | 22nd | 20th |
| Norway | 16th | 8th | 8th | 18th | 5th | 5th | 8th | 4th |
| Iceland | 17th | 23rd | 18th | 20th | 12th | 13th | 9th | 11th |
| Montenegro | 18th | 21st | 9th | 17th | 22nd | 18th | 11th | 23rd |
| Sweden | 19th | 3rd | 5th | 2nd | 1st | 2nd | 14th | 14th |
| Romania | 20th | 20th | 22nd | 16th | 9th | 16th | 21st | 17th |
| Greece | 21st | 14th | 11th | 23rd | 21st | 24th | 18th | 13th |
| Poland | 22nd | 22nd | 19th | 25th | 20th | 22nd | 25th | 22nd |
| Austria | 23rd | 1st | 2nd | 1st | 3rd | 1st | 2nd | 5th |
| UK | 24th | 12th | 15th | 13th | 10th | 14th | 10th | 19th |
| San Marino | 25th | 26th | 25th | 24th | 25th | 26th | 26th | 26th |
| France | 26th | 25th | 23rd | 26th | 23rd | 25th | 23rd | 25th |
There are obviously highlights to pick out from the plethora of data in the tables above. One is caused by wildly differing favourites from the group of musicians (and we’ve sorted this table by the musicians ranking to help illustrate this). Our winner Austria ranks 23rd and Hungary is a clear winner. Note too that Germany (8th) and Slovenia (10th) score much better with these juries, which we could perhaps link to the instruments being clearly, err, mimed, on stage.

Musically wrong: Did the professional musicians not appreciate the orchestration of Conchita’s song? (Photo: Ewan Spence)
The musician group by far is the result here than stands out the most as being unique. If we run correlation analysis on the average results of each of these jury groups compared with each other, our average correlation is 0.647. With 26 songs to pick from we can therefore show strong agreement in voting taste between jury members with different professional backgrounds. Comparing just the musician group to the others, this figure drops to 0.382. This is a result that would give us only a 95% confidence of a statistical trend in voting taste between the musician jury members and the other groups.
However, this is still a high confidence value. The group of musicians stand out as a mathematical oddity, but that is only because all the other jury groups agree with each other so strongly. What we find overall is that for all of these factors we choose from is that there are individual song examples that seem to benefit or lose with some demographics, however on the main part these splits are small and are not dominant factors in Eurovision Song Contest voting.
Shallow Patterns Hide Above A Deep Secret
No matter which subset is taken for analysis for the jury members, few of the results show wildly differing results that demonstrate a clear and obvious split in opinion. Yes the boys liked Poland more, but a rank of 23rd place doesn’t symbolise a seismic shift in voting patterns. The movements above on the whole are small and miniscule in the grand scheme of the contest.
When we look for voting patterns throughout Eurovision history, the general public often look back on that troublesome object of ‘political’ voting (which we previously asked Dr. Eurovision to write about for us). The voting in which where you come from matters more than who you are. It is certainly worth investigating further.
The biggest outlier above is our group of musicians which deviated from the trends of the other jury professions. The musician jury members are part of juries from the following countries:
Armenia, Azerbaijan, Belarus, Belgium, Latvia, Macedonia, Montenegro (2), Portugal, Romania (2), San Marino, Slovenia
If we take the average points of each non-musician juries from these countries above, they correlate to the results of the musician members from these countries with a high positive score of 0.76, a much higher score than the correlations we were calculating comparing the musician group to groups of other professional backgrounds (0.382). The musician group, with many Eastern European jurors present, just demonstrated an pre-dominantly Eastern European voting pattern which is not mathematically distinct from how their countries voted respectfully.
While some interesting differences are clear between the different genders, ages and professions of the jury members, that alone does not give us the full picture in the Eurovision Song Contest voting. The bias of voting as a group appears to indicate an even bigger influence and should be investigated further.
Keep a look out in the near future for our fourth ‘Voting Insight’ which will investigate this impact of juries voting as a bloc together in more detail.
Good work. Really interested that the musicians disliked Conchita so much! It would be interesting to see similar results by region.
Also I could be wrong but I have a feeling that on the whole, the Eastern juries were older than Western, so might that have had an impact on your results by age.