


This article is the follow up to our previous one, where we used data from the Belgian and Spanish televoting numbers to make a best guess for how many votes were cast in the Eurovision Song Contest 2025. Our model, limited by only being able to use data from just two participating nations, predicted that the Song Contest 2025 saw 17 million votes across all participating nations.
This number is not an unrealistic figure given the knowledge that 5 million votes were cast in 2005, and that since then the Eurovision Song Contest has increased in engagement, allows voting throughout the entire show, and has a system via esc.vote that makes casting multiple votes far easier.
But can we take this model one step further? Is it possible to use the data that is available to make a prediction for how many votes were cast at the Song Contest?
I think we can make a guess at this, all thanks to one nation and its broadcasting laws.
Thank you to Tutta l’Italia
Each year in the aftermath of the Eurovision Song Contest, and the flurry of data and analysis that comes from it, Italian broadcaster RAI reveals in-depth information about the Italian televoting. We are treated to exact percentages to the nearest 0.01% of how each country scored from the Italian public at the Song Contest, from first to last.
The reason for this tradition is ultimately thanks to the Contest that birthed everything for us, Il Festival della canzone italiana. Better known to us as Sanremo.
The story begins in 2010. At Sanremo that year, there was a significant disagreement between the different constituencies that made up Italy’s biggest entertainment contest. As broadcast during that year’s contest, orchestra, press, and public were together in loudly protesting the televoting results (fifty percent of the total score that year), which included some orchestra members ripping up their sheet music. Despite the disagreements, protests and backlash, the artistic director of that year’s Sanremo competition did not reveal the breakdowns of votes in the aftermath of that year’s competitition.
However, that became mandatory the following year after. On February 3rd 2011 new legislation was passed by the Italian Communications Regulatory Advisor AGCOM. These measures ensured that there would be within all Italian broadcasting new rules that govern transparency of televoting, stopping the mass calling from call centers and mandating the reveal of televoting statistics after every show. Furthermore, RAI was fined €50,000 for what was deemed “unfair commercial practices” in the administration of the Sanremo televote, which left the televote that year possibly open to manipulation.
While the European Broadcasting Union does not require each nation to reveal their televoting percentages, Italy has been obliged to do so since their return to the Song Contest, with local laws superseding the protocol that the EBU follows for each nation.
We have to make some assumptions, but we can use this data from Italy to make estimates for every other televote across the continent.
A Hyperbolic Curve, Not a Linear Ranking
Looking at the Italian televoting results, it is clear that it is rarely a very close battle at the Song Contest to determine who receives Italy’s top televote. At this year’s Contest in Basel, ‘Tutta l’Italia’ received over one-third of the votes from the Italian public, receiving 34.16 percent of the possible votes, more than double that of second place. At last year’s Contest in Malmö, Israel’s ‘Hurricane’ took 26.02 percent of the total votes, nearly five percent more than ‘Teresa & Maria’ representing Ukraine which scored just over 21 percent.
However, the bottom of the rankings is constantly much closer. The bottom seven songs in Italy’s televote rankings from Basel each scored less than 1 percent of the votes from the Italian public, with only the top eight songs scoring more than 2 percent. It was a similar situation last year, where only the top 11 songs scored more than two percent of the votes from Italy.
We see the following results if we average out the ordinal positions (first, second, third, etc.) that Italy’s televote has awarded in the past five Eurovision editions.
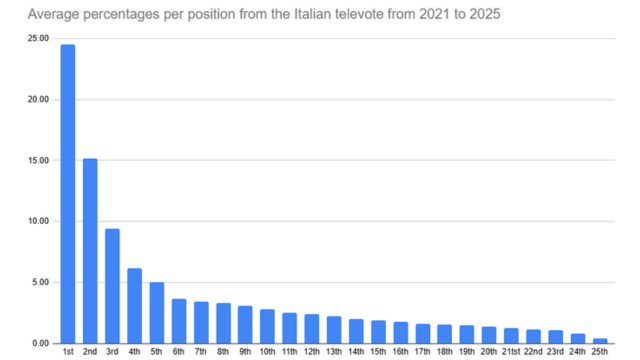
Showing the average percentage received (y-axis) against the ordinal position of the song (x-axis)
With this data, we see that, on average, the winner of the Italian televote scores nearly one quarter of the total possible televote, averaging at 24.53 percent of the votes from the Italian public. Thereafter, it drops rapidly, with an average of 15.15 percent for second place and 9.40 percent for third place. Songs finishing in tenth place, scoring one point from the Italian televote, have averaged 2.82 percent of the total votes.
We only have data from Italy on which to base this, but is it reasonable to expect a similar exponential curve across the entire continent? I believe that is a reasonable expectation. Yes, individual countries may vote in different ratios due to the absence or addition of varying diaspora communities, songs or artists that are well known in the area, or an infinite plethora of other factors.
We have a model to suggest how many votes each country cast at the Eurovision Song Contest. What happens if we assume that each televote ranking each country produces follows a similar percentage distribution to Italy? Can we make an estimate for how many raw votes each song received at the Eurovision Song Contest?
Changes At The Top
If we take the Belgian televote as an example, where it is known that exactly 200,614 votes were cast in the Eurovision Grand Final, assuming a similar distribution to Italy would give televote winner Israel a total of 49,191 votes. Second placed Poland would be expected to receive 30,367 votes, and third placed France would receive 18,828 votes.
It would be a similar story in Spain, where of the known 142,688 votes cast, our model gives an output of 35,004 votes for televote number one Israel, and Ukraine in second place on 21,614 votes. At the bottom end of the table in 24th place was the United Kingdom, which we estimate to have received 1,150 votes from across all of Spain, with Luxembourg, last in the Spanish televote, receiving 585 votes.
If we continue this ratio across all of the Eurovision nations, with our modelled number of votes per country, we will come to the following distribution of votes at the Eurovision Song Contest.

Showing the expected number of votes (y-axis) that our model believes each country received (x-axis)
The results that our model churns out suggest an overwhelming victory for Israel in terms of total votes cast, over twice as many as any other nation received, at just over three million votes. This is around 18.2% of all of the votes we estimate were cast at the Eurovision Song Contest. Israel’s televoting victory in Eurovision 2025 was one dominated by douze points from some of the nations we estimate to have had large voting numbers, including four of the Big 5 nations, as well as those significantly engaged in the Song Contest such as Sweden, the Netherlands and host nation Switzerland.
It is perhaps notable here to point out that televoting 2nd place, ‘Espresso Macchiato’ representing Estonia, comes up a much lower sixth place in this model representation. Of the five sets of douze points that Estonia received, Croatia had the largest modelled number of voters, coming in at 135,000. There are nations in our model that had voting numbers a magnitude higher than this, for example our largest voting countries of Germany and United Kingdom are modelled to have distributed more votes to Israel than the total number of votes cast from the whole of Croatia.
Indeed, it is perhaps most notable here to pick out the rise of Poland (second), Albania (third) and Greece (fifth) into the top of the scoring. A significant portion of their points came from the larger voting nations of Western Europe, which resulted in our model estimating a much higher number of votes than the points suggest. Poland surge from seventh in televoting to second in this model is worth mentioning, while the only douze points came from Ireland and Iceland, again four of the Big Five nations placed Poland in the top four of the televoting, as well as countries like Denmark, Norway and the Netherlands that we modelled to be highly engaged, with strong viewing figures and relatively low cost of voting to income.
And yes, at the bottom of the table lies the United Kingdom after their nil points from televoters. But I think saying they received (obviously, an estimate) over 118,000 votes across Europe is a far nicer way of putting it.
Cash Converting
The final piece of the puzzle is that we are able to retrofit the amount of money spent on each nation in the 2025 Eurovision Song Contest televote. Ranging from Finland’s €1.50 televote cost to Denmark’s 1 DKK, the amount of money spent on voting is considerably different across the different televoting systems across the Song Contest.
We know the number of votes each song received from each country, and we know the cost of each vote, can we calculate the total income from public voting at the Contest.
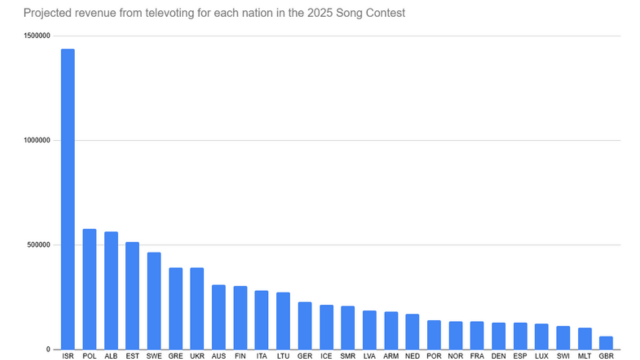
The amount of money spent on voting for each country (y-axis) for the 26 competition nations in the Eurovision 2025 Grand Final (x-axis)
Indeed, we can, and we model that around €16 million was spent in total in televotes at the Eurovision Song Contest. This change causes some of the orders shown by the number of votes cast to change slightly, with the most notable jump at the top of the rankings lifting Estonia up to fourth place, as Estonia was not in the top four of the televote rankings from the nations that had the cheapest televote costs, Denmark, Germany, Ukraine and the United Kingdom.
As expected after the large televote victory, Israel tops this chart as well, with just over €1.4 million of total televote revenue being cast on those voting for Israel, just 8.4 percent of the total vote received, around half the percentage of the total number of votes cast on Israel. Israel’s televote score was concentrated in nations where voting cost was relatively cheaper, with only 3 of the top 10 countries for highest televote cost awarding douze points to Israel.
The Limitations of a Model Upon a Model
We have now in this article taken an investigation into the number of votes each country received at the Eurovision Song Contest, and from there, tried to estimate the number of votes each nation received.
If the first article came with a warning about the model’s limitations, this one should come with flashing lights and alarm bells. Our expectation for the number of votes each country received is based on a model for the number of votes calculated using data from two countries and assuming a linear relationship between variables such as median income, cost of voting and TV viewership. Now on top of that we have made the assumption that every nation votes in Eurovision with the same ratio breakdown as how they vote in Italy.
It means there are now even more reasons for this output to be incorrect.
However, what the output churns out is likely of little surprise to anybody. Israel’s domination of the televote in the larger Western European nations likely meant the gap between their televote top score in Eurovision and the rest of the field was actually wider in raw percentage terms than the points distribution suggested. It’s conceivable that Tommy Cash, with twelve points from smaller nations and big scores from those further east, didn’t score a second place in the televote on raw voting numbers. It’s also very reasonable to suggest that Poland, Albania and Greece did very well with the public on raw numbers of votes, just that they were concentrated in just a few nations rather than spread evenly across Europe.
But just because the outputs are reasonable doesn’t mean that they are in any way necessarily accurate. The results of the Song Contest should not be something that, now many weeks after the Grand Final, are shrouded in such mystery and deliberately obtuse rankings that tell only half the story. It doesn’t have to be immediately after the event, many broadcasters around Europe wait a few days or a week or two before revealing all the breakdowns of televoting statistics, but we would certainly advocate for a reveal of the full televoting data across Europe at some point post every Song Contest. We note that the Slovenian broadcaster has now requested an independent audit of the televoting statistics for the last three Contests. While valiant and understandable, we are looking at what is happening for 2026.
We know from ESC Director Martin Green’s open letter to the Eurovision community in the aftermath of Basel 2025 that issues such as voting campaigns and the ability to vote 20 times per payment method, are up for discussion within the leadership of the Song Contest. Yes, discussions about voting systems and the nature of how promotional campaigns play out so the spirit of the Contest is maintained are sensible to have right now. But the results of Eurovision 2025, and the fallout from them, have many parallels to the fallout from Sanremo 2010, as the large gap between the different voting constituencies fosters a discordant feeling amongst the most important stakeholders.
Perhaps it is for the good health of the Contest that voting transparency is part of any future discussions as well.